This chart tracks the ‘single greatest predictor’ of stock-market returns — and it’s never done this before
Individual stock ownership is a contrarian indicator. It’s flashing a warning.
By Mark Hulbert
Published: Jan. 27, 2026 at 8:05 a.m. ET

U.S. individual investors now have more than half of their portfolios in stocks — a troubling sign.Photo: MarketWatch photo illustration/iStockphoto
Referenced Symbols
There’s a chance that the S&P 500 a decade from now will have lost 5.4% a year after inflation.
The “single greatest predictor” of future stock-market returns has never been more bearish.
This indicator is based on the average U.S. household’s allocation to equities. It was introduced in 2013, and given its name by the anonymous author of the “Philosophical Economics” blog. The indicator’s creator reported that it had a better track record predicting the U.S. stock market’s 10-year return than any of the other valuation indicators of which he/she was aware. I also have failed to find an indicator with a better record.
The indicator is calculated based on data compiled quarterly by the U.S. Federal Reserve. Because of the federal government’s shutdown last fall, the data for 2025’s third quarter has only recently been released. This latest data shows the average household’s equity allocation has hit a new high, at 54.9%. It’s almost certainly even higher now than then.
Looking beyond U.S. AI stocks See All Videos
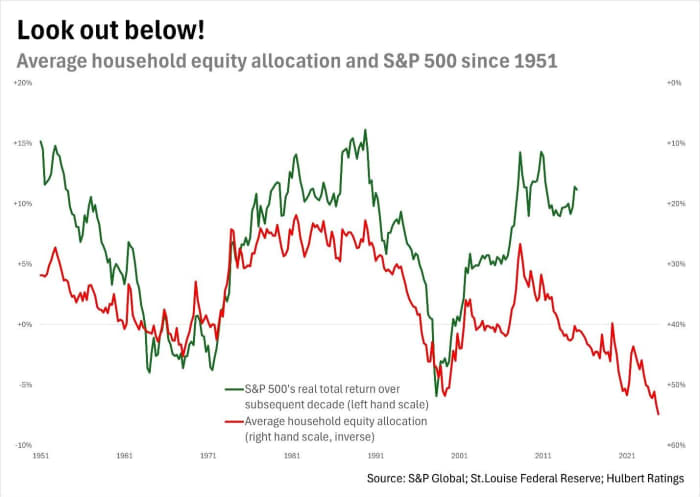
Higher allocation levels are bearish. The chart above plots the S&P 500’s
real total return over the subsequent decade (left-hand scale) alongside the average household equity allocation (inverted right-hand scale).
To appreciate the impressive correlation that exists between these two data series, consider a statistic known as the r-squared — which measures the extent to which one series (average allocation, in this case) predicts and explains the other (the S&P 500’s subsequent 10-year return). The r-squared is a highly significant 59.4%.
Just how bearish is the latest reading of individual stock ownership? I constructed an econometric model based on the historical correlations between the two data series in the chart above. According to the model, the S&P 500 a decade from now will have lost 5.4% a year after inflation.
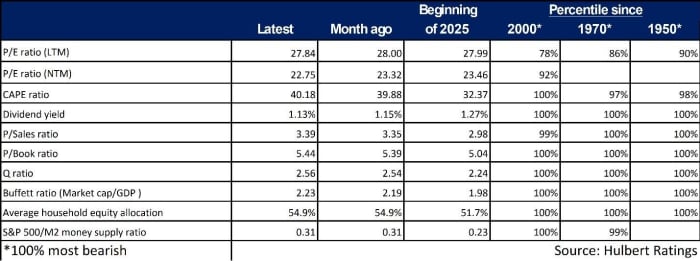
Status of other valuation indicators
The table below lists the current values of the 10 valuation indicators I periodically update in this column. They were chosen because each has a statistically significant track record predicting the U.S. stock market’s return over the subsequent decade. Though not all are telling as bearish a story as the average equity allocation, the message is still bearish: On average, they are forecasting that the S&P 500 will lag inflation over the next decade by 2.6% annualized.
Mark Hulbert is a regular contributor to MarketWatch. His Hulbert Ratings tracks investment newsletters that pay a flat fee to be audited. He can be reached at mark@hulbertratings.com.
More: Don’t ask your financial adviser to make a market prediction — you won’t like what you hear
Plus: These 20 stocks are strong choices for momentum investors
View this MarketWatch article CLICK HERE

Leave a comment