As stocks wobbled, the S&P 500 held a critical threshold. Here’s what history says happens next.
The benchmark index has been above its 50-day moving average for 133 sessions, the longest streak since 2007. But that nearly came to an end on Friday.
Published: Nov. 7, 2025 at 5:56 p.m. ET
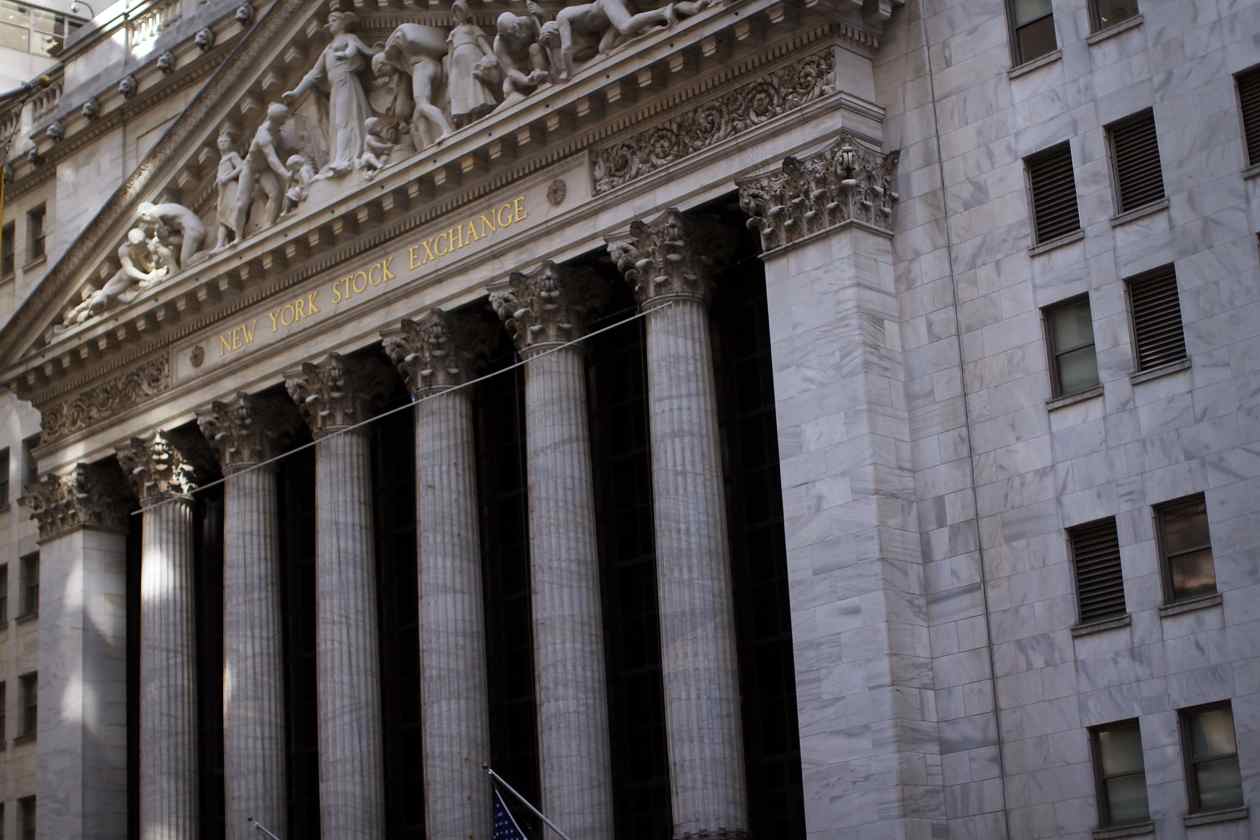
The rally in stocks could still have legs, based on this closely watched technical indicator. Photo: Getty Images
Referenced Symbols
Key Points
About This Summary
- The S&P 500 just achieved its longest streak above its 50-day moving average since 2007.
- The Nasdaq Composite and S&P 500 briefly dipped below their 50-day moving averages, but recovered.
- Investor-sentiment gauges, like the VIX and CNN’s Fear & Greed Index, indicate increasing alarm despite stocks being near record highs.
The trend still appears to be the stock market’s friend.
The S&P 500 on Wednesday tallied an impressive accomplishment: It reached its longest streak above its 50-day moving average since 2007, surpassing a 130-day stretch that ended in May 2011, Dow Jones Market Data showed.
Just two days later, that streak nearly came to an end, and not just for the S&P 500
The Nasdaq Composite
COMP-0.21%, which has also been trading above its 50-day average since May 1, nearly snapped its longest streak above its 50-day moving average since 1995.
There are now more ETFs than stocks. Is that good for investors? See All Videos
Technical strategists monitor where indexes are trading relative to their 50-day moving average for several reasons. But they often use it to help determine whether a rally still has legs, or looks due for a pullback.
Both benchmark indexes briefly dipped below the key trend line as the week was wrapping up, but were ultimately spared by a late-session comeback Friday that saw the S&P 500 clinch its biggest intraday turnaround since April. That also extended its streak above its 50-day average to a 133rd session, Dow Jones Market Data showed.
Now, the S&P 500 and Nasdaq Composite sit at an important crossroads. Wall Street portfolio managers and strategists have blamed a number of factors for the drop in stocks this week — the largest for the Nasdaq Composite since the week President Trump first unveiled his “liberation day” tariffs back in April.
There has been growing discomfort with lofty valuations for AI-related stocks, mounting signs of a weakening U.S. labor market and struggling consumers, and worries about the possible blowback from a government shutdown that this week became the longest in U.S. history.
Of note, a late-day offer Friday by Sen. Chuck Schumer, the leader of the Democrats in the Senate, on a path to ending the shutdown was credited by some with helping to inspire a turnaround in stocks.
Even with this week’s pullback, stocks still were sitting relatively close to record territory; the S&P 500 only finished within 3% of its all-time high from late October on Friday.
But several gauges of investor sentiment were hinting at a greater degree of alarm. The Cboe Volatility Index
VIX-2.15%, better known as the VIX or Wall Street’s “fear gauge,” ended above 19, just shy of its long-term average. And CNN’s Fear & Greed Index ended at 21, leaving it in “extreme fear” territory, according to the indicator.
Bad breadth
Stocks have been on an incredible run since the April selloff, with the S&P 500 climbing for six straight months through October — its longest monthly winning streak since 2021, data showed.
Much of these gains have been powered by shares of companies expected to benefit from AI. But while stocks without as much exposure to AI had, at one point, started to pick up the slack, the divergence between the market’s winners and losers has been growing again recently.
“It’s really a tale of two markets right now, because anything related to the consumer is getting absolutely killed,” said George Cipolloni, a veteran portfolio manager who spoke with MarketWatch on Friday.
Craig Johnson, chief market technician at Piper Sandler, said that several breadth measures he uses show that the majority of U.S.-listed stocks priced above $2 a share and with a market capitalization of at least $25 million were in a downtrend.
“Something like 62% of the market is in some form of a downtrend,” he said. “The internals look terrible. The breadth in this market is terrible.”
This suggests that major indexes like the S&P 500 and Nasdaq Composite are likely headed lower, Johnson said, adding that a pullback of around 10% or so could soon materialize.
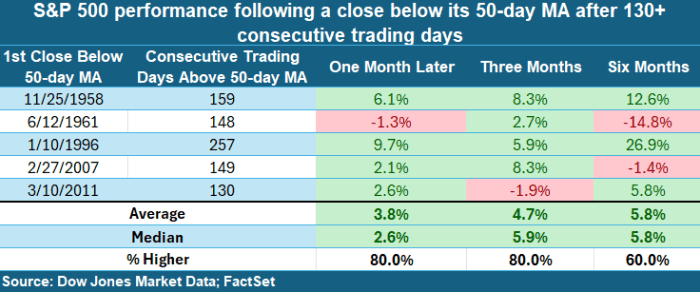
What history says
Even if that retreat happens, any break below the 50-day moving average typically doesn’t signal the start of a protracted bear market for the S&P 500. Returns within three months and six months have historically been positive, according to Dow Jones Market Data.
There have been some notable exceptions, however. In 1961, a break below the 50-day moving average, after an extended streak above it, marked the start of a more lasting bout of weakness. Two years after a similar setup in 2007, investors found themselves mired in a punishing bear market caused by the 2008 financial crisis.
Yet every once in a while, a dip below the 50-day moving average can be healthy for the market, Piper Sandler’s Johnson noted.
Ken Jimenez contributed.
Partner Center
News For You

4 things worrying investors as U.S. stocks see worst start to a month since April
MarketWatch
Nov. 8

Where next for Big Tech stocks? Pay attention to bitcoin, says Citi.
MarketWatch
Nov. 7

In America’s Suburbs, Frustrated Middle-Class Voters Are Up for Grabs
WSJ
Nov 8

Dow Jones Futures Fall As Stock Market, Palantir Break Key Levels; Tesla Shareholders OK Elon Musk Pay
IBD
Nov. 7

Genetically Engineered Babies Are Banned. Tech Titans Are Trying to Make One Anyway.
WSJ
9 hours ago

The shutdown is starting to ‘bite the economy,’ top Trump aide warns. The Senate is struggling to make a deal.
MarketWatch
Nov. 7
About the Author

Joseph Adinolfi is a markets reporter at MarketWatch.
What to Read Next
4 things worrying investors as U.S. stocks see worst start to a month since April

Tech selloff breaks major S&P 500 support — but here’s when stocks really unravel

Tech stocks just had their worst week since the April tariff selloff. Why it’s about time.
View this MarketWatch article CLICK HERE

Leave a comment